6.4. Hbond moving average and RMSD
This section explains technical details in order to answer questions in Section 6.5. We advise you to take a look at questions first.
To load the trajectory use the VMD program on your local machine if you use Windows or use vdi.epfl.ch if you have a Mac.
Connect to EPFL VPN before starting this process (This may cause problems if you reside in a FMEL residence).
To upload your files to the VDI file system you can use MyNAS https://mynas.epfl.ch/index.php to find out the correct url.
On Mac e.g the Url you can put into Finder is similar to this: smb://files[0-9].epfl.ch/dit_files[0-9]_indiv/data/username. The trajectory files can then be dragged into this folder and they will appear in the VDI.
In VMD load the trajectory by clicking on File → Load new molecule.
Here first select the trp_cage_gb.prmtop file and the load the trp_cage_gb.nc into the same molecule.
6.4.1. RMSD Alignment and Calculation
To perform an RMSD fit of two structures (or trajectories) and to
calculate the change in RMSD over time, load both structures into VMD as
new molecules. Click on
Extensions→Analysis→RMSD Trajectory Tool which
will show an RMSD Trajectory Tool window. In the Trajectory panel,
select Plot. In the Reference Mol panel, click Selected, and in
the Selection Modifiers panel, click Backbone. Select the structure
you wish to compare against (e.g 1L2Y) to designate it as the reference
structure for the RMSD calculation. Finally, click ALIGN to first
align the structures or MD trajectory to the reference structure, and
once this is completed, click RMSD to produce the RMSD graph.
6.4.2. Hydrogen-Bond Analysis
To select individual hydrogen bonds, simply select Mouse→
Label→ Bonds (or press 2 on your keyboard) and select the
appropriate polar atom and hydrogen. To monitor changes in this distance
throughout the trajectory, click Graphics→ Labels... to open
the Labels window. Select Bonds from the drop-down menu, and click
Graph... from the Graph tab with the hydrogen bond preselected.
To monitor changes in the total number of hydrogen bonds present within
the molecule over the course of the trajectory, you can click
Extensions→ Analysis→ Hydrogen Bonds to open the
Hydrogen Bonds window. Select the correct molecule from the Molecule
field, leave Selection 1 as ‘protein’ and enter 0:4999 within the
Frames text field. Select Only polar atoms and leave the
Donor-Acceptor distance and Angle cut-off at 3 and 20 respectively.
Plot the data using MultiPlot, and also write output to a file named
hbonds.dat. Finally, select Find hydrogen bonds.
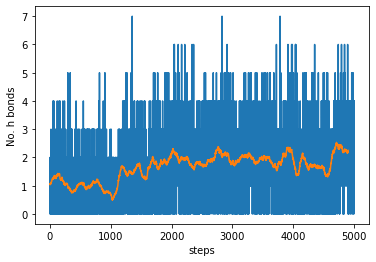
6.4.3. Plotting the content
For this we can use numpy and matplotlib:
Note: the moving average is centred on each data point, therefore the last \(\frac{windowsize}{2}\) data points will not be representative.
Download the hbonds.dat file and upload it either to Google Colab or noto.epfl.ch.
import numpy as np
import matplotlib.pyplot as plt
hbonds=np.loadtxt('hbonds.dat')
def moving_average(x, w):
    return np.convolve(x, np.ones(w), 'valid') / w
mavg=moving_average(hbonds[:,1], 100)
fig, ax = plt.subplots(1)

ax.plot(hbonds[:,1])
ax.plot(mavg)
ax.set_xlabel('steps')
ax.set_ylabel('No. h bonds')
plt.show()